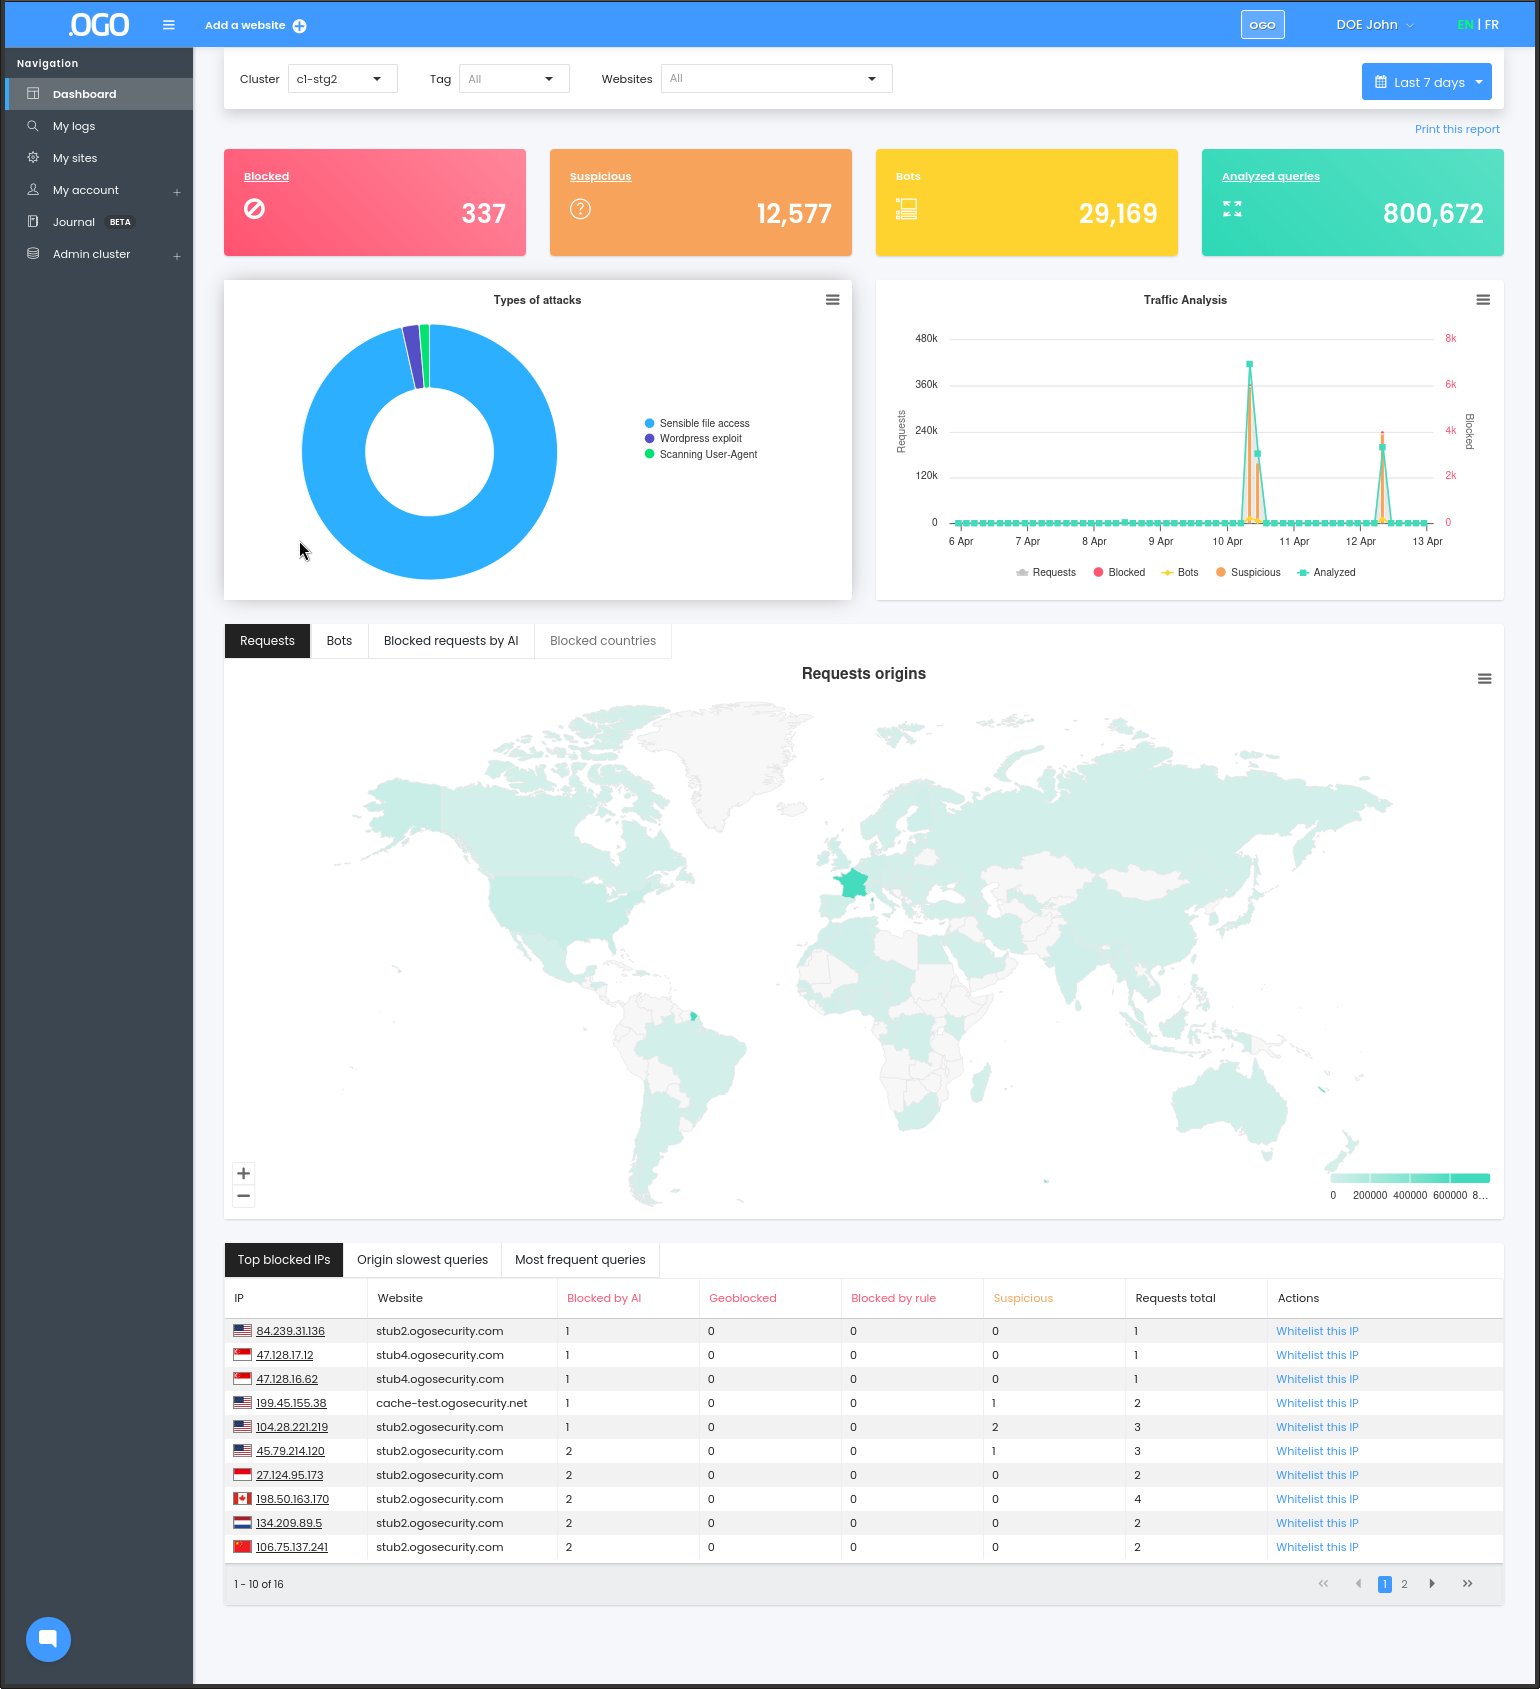
1. The first banner reports on :
a. The number of blocked attacks
b. The number of suspicious requests
c. The number of pages scanned by the robots
d. The number of requests scanned during the specified time period
2. The second banner gives information about the type of attacks blocked, and a view of your site's traffic during the selected time period.
3. The world map shows, depending on the tab :
a. The origin of the requests
b. The origin of the robots
c. The origin of the attacks
d. The countries you have decided to block.
4. Finally, the last banner is composed of several tabs that allow you to view:
a. Top IPs blocked
b. Origin slowest requests
c. Most frequent requests
5. The organization selector at the top-right allows you to change between organizations ("multitenant").